EcoLenz: The NbS Portfolio Intelligence Platform
EcoLenz is Kumi Analytics' browser-based portfolio and visualization platform, purpose-built for carbon project developers, ESG teams, and financial analysts who need to monitor multiple Nature-Based Solutions projects simultaneously. EcoLenz surfaces KACSAT's dMRV outputs — including biomass maps, land cover change layers, deforestation alerts, and carbon stock estimates — in an interactive, non-technical interface. No GIS software or remote sensing expertise is required.
Request Demo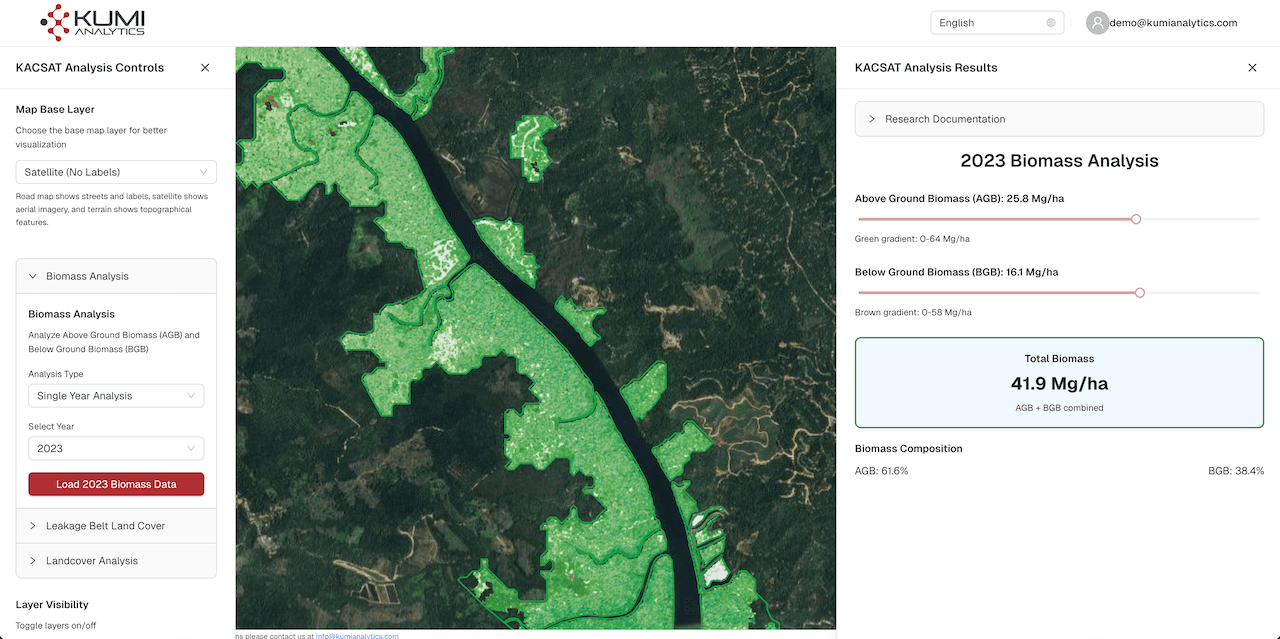
Inside the platform
A browser-based workspace for maps, layers, time series comparisons, and GIS data exports—built for teams who want to share results to both technical and non-technical users.
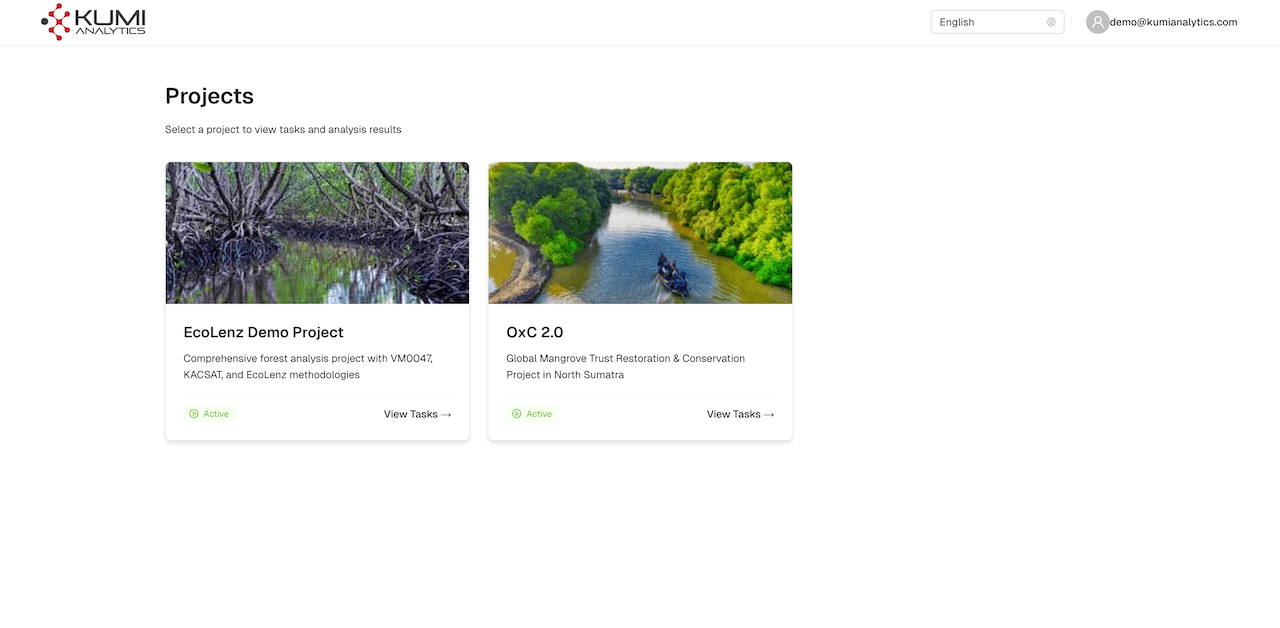
Project portfolio
Pick an initiative, see status at a glance, and open tasks for each site from a single projects hub.
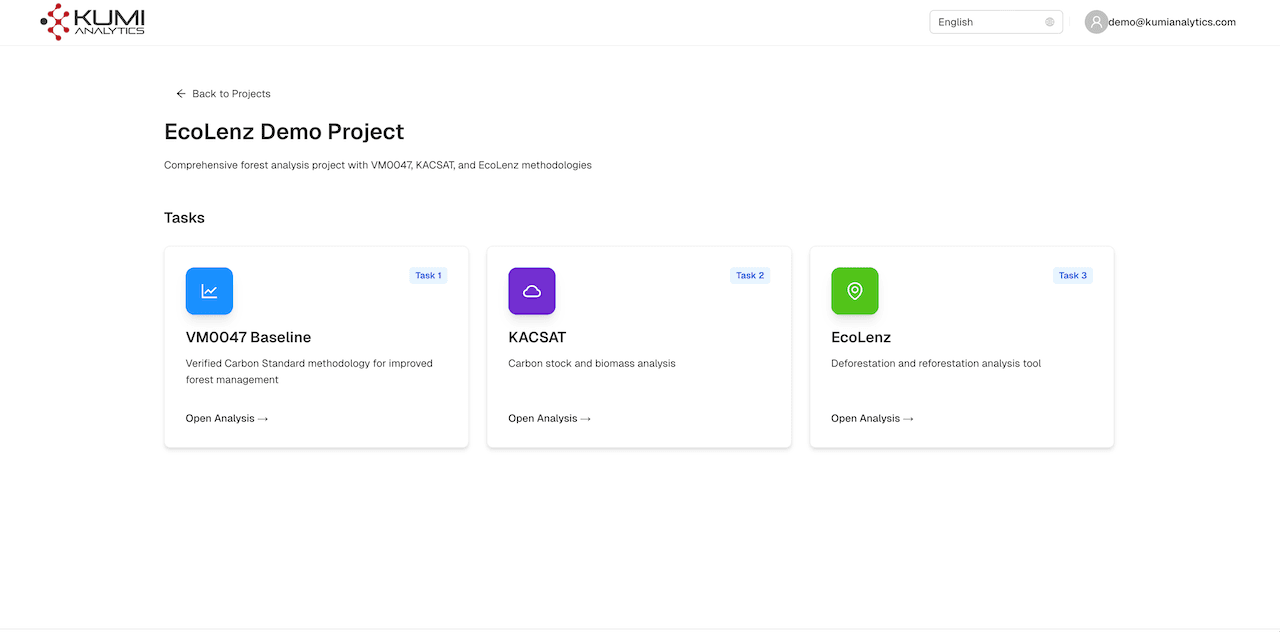
Tasks & methodologies
From one project, visualize results, launch data exploitation and analysis tools, export data to GIS systems ,and more.
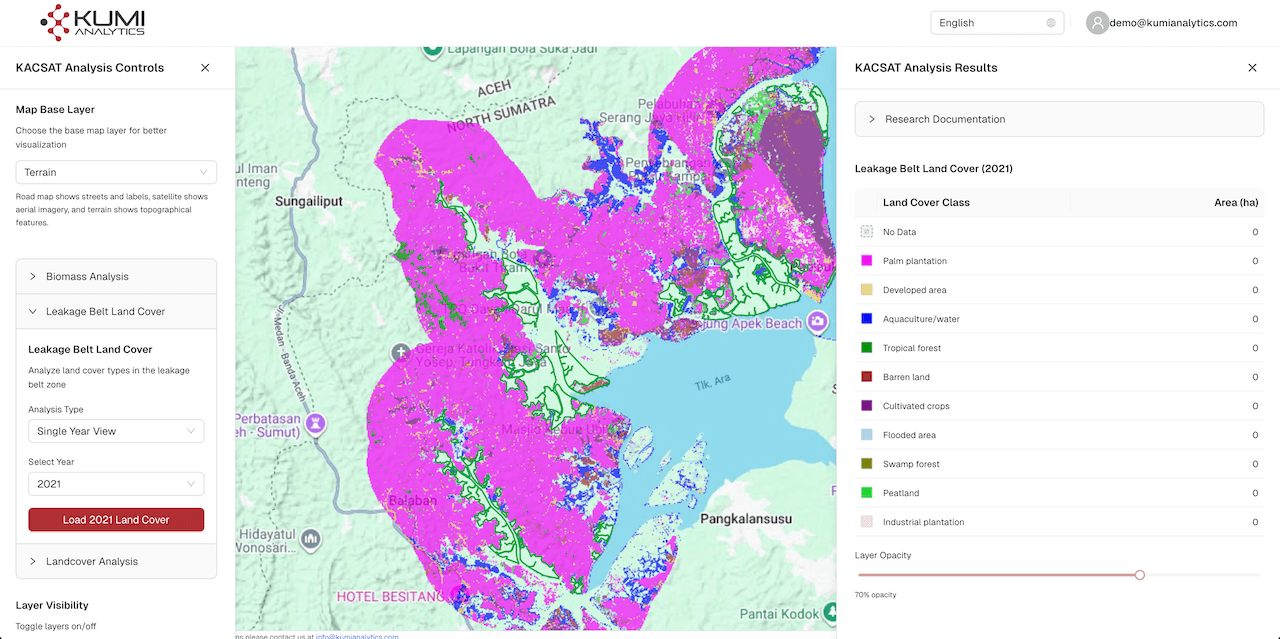
Map workspace
Drive analyses from the left panel—choose layers, land cover, biomass—visualize results on an interactive map in the center—and get results and map legends on the right.
Ecolenz Characteristics
Core capabilities behind the interface you see above.
Web-Based GIS Viewer
No specialist software required. Access insights directly in your browser.
Rich Layer Visualization
Visualize terrain, soil, biomass, land cover change, deforestation layers and more.
Year-to-Year Split Comparison
Compare changes over time with interactive map controls.
Flexible Export Options
Download results in GeoTIFF, PNG, CSV, and PDF formats.
Secure, Role-Based Access
Control who sees what with enterprise-grade security.
Portfolio Dashboard
View and manage multiple projects at a glance from a single dashboard.
Designed for
Carbon Project Developers
ESG Teams
Financial Analysts
Frequently asked questions
Get started with EcoLenz
Contact us to discuss how EcoLenz can support your projects and help you access remote sensing insights with ease.
Request Demo