Advanced Land Cover Classification for Carbon Baselines and NbS Feasibility
Kumi Analytics delivers consistent, standards-aligned land cover mapping from national wall-to-wall products (10 m and 30 m resolution) to project-level feasibility assessments. Our land cover products are specifically designed to support Nature-Based Solutions project development — providing the deforestation baselines, forest/non-forest classifications, and ecosystem type maps required by Verra, Gold Standard, and REDD+ national accounting frameworks. The same taxonomy applies at every scale, from country-wide screening to individual project sites.
Discuss Your Use Case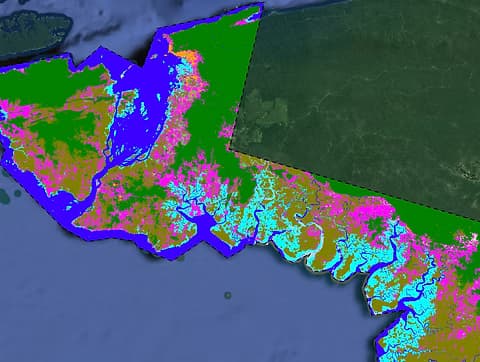
Our Landcover Capabilities
National & Regional Mapping
Wall-to-wall classification at 10 m or 30 m resolution with a consistent legend for countries or regions—ideal for reporting, baselines, and policy.
Multi-Scale Classification
Same taxonomy from national down to project scale. Compare country-level trends with site-level feasibility without reconciling different legends.
Change Over Time
Landcover change layers and time series for deforestation, urban expansion, agriculture, and restoration—with clear timelines for reporting.
Custom Legends
Align to national standards (e.g. CORINE, ministry schemes) or project-specific classes. We adapt the legend so outputs fit your workflows.
Cross-Sector Applications
One product for carbon, agriculture, urban planning, biodiversity, water, and ESG. Single source of truth across teams and reporting.
Feasibility & Screening
Fast, coarse classification to shortlist areas for projects—from national screening to initial site feasibility before detailed surveys.
Flexible Taxonomy, Every Scale

Consistent Classification Across Resolutions
We use a single, coherent landcover taxonomy so that national maps and project-level maps speak the same language. That means:
- One legend from country-wide to site-level—no reconciling different systems.
- Standards-aligned options (e.g. UN-FAO LULC–style) for reporting and audits.
- Same classes support carbon, agriculture, planning, and biodiversity use cases.
Multi-Source Fusion
Optical and SAR data are combined to improve robustness to cloud cover and seasonal gaps. You get stable classification across seasons and regions.
Validation & Uncertainty
Accuracy assessment and, where needed, uncertainty quantification so outputs are defensible for reporting, audits, and decision-making.
Benefits for Your Organisation
Single Source of Truth
One landcover product for carbon, agriculture, planning, and reporting—reducing duplication and inconsistency across teams.
Faster Feasibility
Move from national or regional screening to project shortlists quickly, with the same taxonomy at every scale.
Standards-Aligned
Outputs compatible with UN-FAO LULC, IPCC, and national reporting frameworks—so they slot into existing processes.
From National Mapping to Project-Level Feasibility
Tell us your geography and use case—we can support wall-to-wall mapping, custom legends, or rapid feasibility screening.
Discuss Your Use Case